Working with Data
Submitted by Natasha Galliford on 12 June 2017.
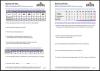
This resource uses several tables of data and requires the user to complete calculations based on the data such as mean, median, mode and range as well as percentages and rounding. There is also a task where the learner must create a chart based on a table of data.
Editor’s note
There is something for everyone in this robust resource as it’s split into three sections: weather, Premier League and Glastonbury Festival. With answers and curriculum mapping.
Resource File(s)
Resource type
Physical format
6 page PDF
Maths
- Log in to post comments
See also
More like this