The World of Weather
Submitted by Alexander Ross on 10 September 2013.
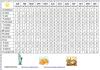
A data chart of average monthly high and low temperatures for a selection of world cities is used to answer functional maths questions.
Skills tested include accuracy of reading data, ordering positive and negative numbers, calculating the mean and range of data including negative numbers.
There is a tricky anagram to finish off the worksheet, which will appeal to some leaners who like puzzles and wordskills.
The chart could be used separately and many other questions devised from the information it contains.
Editor’s note
Answers and full curriculum mapping are included
Resource File(s)
Resource type
Physical format
Excel sheet & 8 page pdf
Level
Maths
- Log in to post comments
See also
More like this