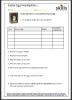
This is a data handling activity aimed at L1/2 learners that involves calculating the mean and range, constructing a bar chart and then making sense of what the results mean in a functional context.
More observant learners may rename this activity ‘Sophie’s choice’!
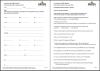
This aural check was used to assess learners before they attended my intensive 1:1 support / revision sessions for the Level 1 Functional Maths exam. These were generally students that I had not met or taught before.
Comprehensive, step by step 12 page workbook.
Students must research their own budgets and local financial institutions before making major financial decision such as costing an event and taking out a loan to buy a car.
Covers money, decimals, ratio and percentages (interest rates). Fully mapped to E2-L1 Functional Maths.
Two differentiated investigations: one aimed at E3 learners, the other at L1.
Each covers a wide range of skills – including measures, bar charts, sell by dates, shapes and money. The L1 version includes a ‘best-buy’ section and fractions.
Adapted from previous Skillsworkshop resources including Easter Numeracy (Carrie Bray 2010) and Easter Eggs – Value for money? (Judith White, 2012). These can be found under “See also” below. Tutor warning
In this activity, learners have to calculate how much paint is required for a specified job, find prices from different sources and work out total prices. This can then be compared. The resource is in two versions – one with formulae for the required calculations and one without – different pages from each version can be mixed and match to meet different learners’ needs.
The activity requires internet access – however price lists could be substituted for this if this is not available in your context.
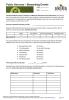
A Functional Skills based project aimed at my Public Service students who are going to be on a Stewarding course. I linked some questions about rotas and timetables with a question about steward to crowd ratios to tie in with their short course.
An interesting meld of description, investigation, paired discussion and tasks.
Ideal introduction to L1 averages – also useful at high E3.
Adapted from one page of Nikki Gilbey’sData Collection and Averages – functional tasks (listed below under See also).
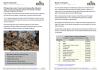
A topical and challenging series of differentiated questions for upper E3 to Level 2. Based on a news report about the May 2015 relief effort and a table of statistics about the world’s largest earthquakes.
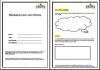
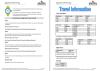
I wanted to create a resource to enable my students to practise calculating with time.
Most of the students work in Wiltshire, but live in Yorkshire, so I thought it would be fun if they explored different travel methods to Yorkshire to see which was the fastest. The travel distances and times were from the Internet and I created this resource differentiated for Levels 1 and 2.
Editor’s note
Clever differentiation. Although both sets of questions are the same, the Level 2 learner has more complex information to choose from.
Level
Level 2
Level 1
Maths
AN MSS1/L2.2 Calculate, measure and record time
AN MSS1/L1.2 Read & measure time and use timetables
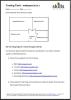
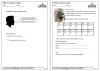
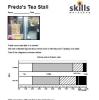
The main resource has four pages. Three of the pages contain a chart and a brief to a group of students to discuss and write some sentences saying what the chart tells them. The twist is that each group of 3 students has a different chart drawn from the same data as the groups next to them. The fourth page has the table from which the charts were drawn.
The charts used are: dual/clustered bar chart comparing types of drink sold on two days. A stacked/composite bar chart and a percentage bar chart of the same data.