I’ve only briefly skimmed through but some of these new mastery resources for L1 & L2 Functional Maths (and GCSE resits) look amazing! Includes full 33 hour (22 x 1.5 hr lessons) schemes of work, lesson plans, handouts and slides.
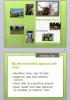
A useful introductory PPT and accompanying team data sheets for covering L1-2 statistics.
[img_assist|nid=5698|title=|desc=|link=popup|align=left|width=100|height=79]
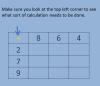
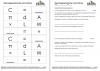
My L1 learners were really struggling to remember what to do to convert units of measurement and were getting very confused at the initial stage, so I made this resource and laminated it so that it was available for them to look at if they couldn’t remember. Could also be made into a poster.
A resource I created to support my students getting used to what they needed to divide or multiply by to convert between units. Can easily be laminated for repeated use, or increased in size and turned in to a poster.
This is a practical handling data task at L1 and L2 which uses the Internet to find the necesssary data in order to complete a Expenses claim form.
I work with Landbased students most of whom visit an exhibition at the Bath & West show ground. In this task they have to work out how much it will cost them to travel to the site and how much the entry fee is, then enter this information onto a expenses claim form as if they were submitting it to an employed to reclaim their costs.
For L2 students they need to find the actual cost of the fuel they use for the journey.
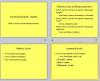
A power point and interactive cards to introduce the students to reversing calculations / formulas.
The animated PPT demonstrates the basics of how to rearrange formulae and use reverse calculations to self check answers.
The cards with symbols, can be used to physically rearrange the formula showing the moves of each symbol. These allow the tutor to spend some time talking the less able students through the process. Students can then use the card to complete a short worksheet.
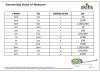
In the construction trades there is still a need for some students to understand the difference between Imperial and metric units of measure. This is a Powerpoint presentation to help with this. I have used it with E3 and L1 students.
Editor’s note
I have classified this as L1 and L2.
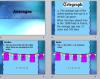
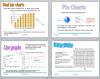
I created this powerpoint to help my students learn the parts and uses of graphs and charts. They can also revisit it on Moodle to remind themselves of labels etc., while revising for the exam.
Editor’s note:
Covers tallies, pictograms, bar charts (vertical, horizontal, single, dual), pie charts, line graphs, conversion graphs and scatter graphs.