A useful introductory PPT and accompanying team data sheets for covering L1-2 statistics.
[img_assist|nid=5698|title=|desc=|link=popup|align=left|width=100|height=79]
This is a practical handling data task at L1 and L2 which uses the Internet to find the necesssary data in order to complete a Expenses claim form.
I work with Landbased students most of whom visit an exhibition at the Bath & West show ground. In this task they have to work out how much it will cost them to travel to the site and how much the entry fee is, then enter this information onto a expenses claim form as if they were submitting it to an employed to reclaim their costs.
For L2 students they need to find the actual cost of the fuel they use for the journey.
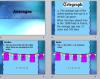
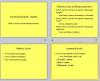
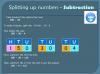
A power point and interactive cards to introduce the students to reversing calculations / formulas.
The animated PPT demonstrates the basics of how to rearrange formulae and use reverse calculations to self check answers.
The cards with symbols, can be used to physically rearrange the formula showing the moves of each symbol. These allow the tutor to spend some time talking the less able students through the process. Students can then use the card to complete a short worksheet.
In the construction trades there is still a need for some students to understand the difference between Imperial and metric units of measure. This is a Powerpoint presentation to help with this. I have used it with E3 and L1 students.
Editor’s note
I have classified this as L1 and L2.
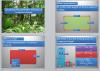
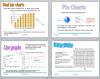
I created this powerpoint to help my students learn the parts and uses of graphs and charts. They can also revisit it on Moodle to remind themselves of labels etc., while revising for the exam.
Editor’s note:
Covers tallies, pictograms, bar charts (vertical, horizontal, single, dual), pie charts, line graphs, conversion graphs and scatter graphs.
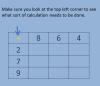
A detailed lesson plan accompanied by a PPT and a lesson objective checker sheet. The lesson recaps place value and introduces students to decimals and using money in practical situations.
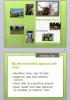
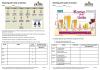
This lesson is designed to embed adding and subtracting, ratio and proportion, etc. whilst looking at the important issue of alcohol consumption and units. Students are able to look at the RDA of alcohol consumption, binge drinking, etc. in the introductory PPT. They can then complete maths worksheet which involves calculating and adding units, converting units and reading data.
It includes a video clips, visual imagery and written notes.
Fully mapped to, and ideal for, L1 Functional Maths.
Level
Level 1
Maths
HD1/L1.1
N1/L1.10
AN N1/L1.7
Functional Maths - numbers and the number system
Functional Maths - handling information and data
General
Generic resources for literacy, numeracy and beyond