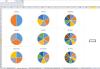
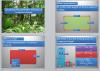
This is a set of worksheets in a MS Excel workbook that deals with fractions.
- Sheet one: a set of pictures (pie charts) that shows fractions from halves to tenths
- Sheet two: equivalent fractions with two pie charts, learners can input fractions and see if they are equivalent by looking at the shape of the pie charts
- Sheet three: starting to look at fractions being equivalent to decimals with two pie charts one for fractions and one for decimals
Level
GCSE L1-5
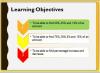
Level 2
Level 1
Maths
N2/L2.3
N2/L2.1
Adult Numeracy N2/L2.2
Adult Numeracy N2/L1.3
GCSE N10 (Work interchangeably with terminating decimals & their corresponding fractions)
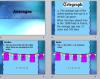
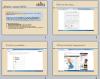
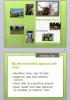
A useful introductory PPT and accompanying team data sheets for covering L1-2 statistics.
[img_assist|nid=5698|title=|desc=|link=popup|align=left|width=100|height=79]
PPT with title slide and 3 slides and a set of suggested questions to go with it.
A further worksheet showing the number of seats for the parties for the last and new parliament with tasks for E3 to L2 learners.
Editor’s note
A great resource for prompting general discussion about elections, statistics, etc.
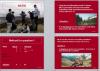
This is a PowerPoint slide show on ratios (with answers) to use with Army soldiers. The subject matter is Adventurous Training and Mountain Leader Trainers (MLTs). Most of the presentation deals with the instructor/novice ratio. The final slide is about ammunition.
This is a practical handling data task at L1 and L2 which uses the Internet to find the necesssary data in order to complete a Expenses claim form.
I work with Landbased students most of whom visit an exhibition at the Bath & West show ground. In this task they have to work out how much it will cost them to travel to the site and how much the entry fee is, then enter this information onto a expenses claim form as if they were submitting it to an employed to reclaim their costs.
For L2 students they need to find the actual cost of the fuel they use for the journey.
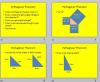
This PowerPoint was used to introduce Pythagoras’ Theorem to Functional Skills college students whose main course work is to do with the Building Trades (Carpenters, Electricians). The last 4 slides therefore deal with using Pythagoras’ theorem to calculate the length of roof rafters.
Editor’s note
I realise that using Pythagoras’ theorem is beyond the scope of L2 Functional Maths Exams but this is a very useful PPT due to the vocational questions. Would also be useful for GCSE Maths.
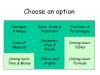
An animated PowerPoint presentation (86 slides) that covers several topics: Fractions & Percentages;Units of Measure; Charts & Graphs; Ratio, Scale & Proportion; Perimeter, Area & Volume; Averages and Range. There are also some links for a planned inclusion of other topics at a later date (Time & Money, Tables and Formulae).
This presentation can be used in class, driven by the teacher, but it is also ideal as a guide for self-study.
Not really suitable for handouts, as there are many animated sequences that would overlap on the printed page.
A power point and interactive cards to introduce the students to reversing calculations / formulas.
The animated PPT demonstrates the basics of how to rearrange formulae and use reverse calculations to self check answers.
The cards with symbols, can be used to physically rearrange the formula showing the moves of each symbol. These allow the tutor to spend some time talking the less able students through the process. Students can then use the card to complete a short worksheet.