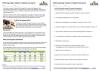
Very topical and challenging set of tasks based on a news report about the new 5p charge for plastic carrier bags introduced in England on October 5 2015.
Questions range from Entry 3 to high Level 2 and cover dates, large numbers, bar charts, averages, interpreting data in tables, mean average and percentages. It also challenges learners’ reading and English comprehension skills. Bar chart question requires graph paper or Excel.
A useful introductory PPT and accompanying team data sheets for covering L1-2 statistics.
[img_assist|nid=5698|title=|desc=|link=popup|align=left|width=100|height=79]
PPT with title slide and 3 slides and a set of suggested questions to go with it.
A further worksheet showing the number of seats for the parties for the last and new parliament with tasks for E3 to L2 learners.
Editor’s note
A great resource for prompting general discussion about elections, statistics, etc.
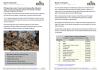
A topical and challenging series of differentiated questions for upper E3 to Level 2. Based on a news report about the May 2015 relief effort and a table of statistics about the world’s largest earthquakes.
Two great resources for Red Nose Day, differentiated for L1 and E3.
Each covers many aspects of Functional Maths. Topics include money, ratio, proportion, fractions, extracting from tables, mean and range, calendars and much more.
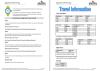
I wanted to create a resource to enable my students to practise calculating with time.
Most of the students work in Wiltshire, but live in Yorkshire, so I thought it would be fun if they explored different travel methods to Yorkshire to see which was the fastest. The travel distances and times were from the Internet and I created this resource differentiated for Levels 1 and 2.
Editor’s note
Clever differentiation. Although both sets of questions are the same, the Level 2 learner has more complex information to choose from.
Level
Level 2
Level 1
Maths
AN MSS1/L2.2 Calculate, measure and record time
AN MSS1/L1.2 Read & measure time and use timetables
A challenging set of questions based on a short text about the stunning Blood Swept Lands and Seas of Red installation at the Tower of London.
Questions cover number measures, time, money, area – many calculations involve working with very large numbers.
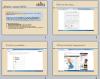
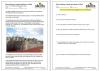
A worksheet where learners research and record findings using Google maps. The idea is to get them familiar with reference points for distances. Gives learners an idea how far places are from them in real terms, and teaches them to estimate with measurements.
Also provides good practice with the Google maps app on phones, Mac or PC.
Level
Level 1
Entry Level 3
Entry Level 2
Maths
AN Length weight capacity temperature scales
Functional Maths - measures, shape & space
ICT
Functional Skills ICT: Finding and selecting information
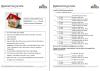
I have created this mini task to assess numeracy/functional skills learners (Entry level 3 to level 1) in
- understanding and using common date formats
- using a calendar
- reading time in the 12-hour and 24-hour formats
- recording time in the 12-hour analogue clock
- knowing that 12:00 or 1200 is midday
Level
Level 1
Entry Level 3
Maths
AN MSS1/L1.3 Calculate with and convert between units of time
AN MSS1/L1.2 Read & measure time and use timetables
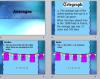
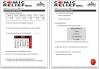
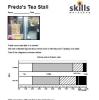
The main resource has four pages. Three of the pages contain a chart and a brief to a group of students to discuss and write some sentences saying what the chart tells them. The twist is that each group of 3 students has a different chart drawn from the same data as the groups next to them. The fourth page has the table from which the charts were drawn.
The charts used are: dual/clustered bar chart comparing types of drink sold on two days. A stacked/composite bar chart and a percentage bar chart of the same data.