Functional skills maths.
Extract information from mileage and distance (network) diagrams. Complete a mileage chart. Editor’s note
With worked solutions, pop up help and a final challenge question.
Ideal as an introduction or for revision.
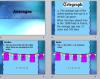
A useful introductory PPT and accompanying team data sheets for covering L1-2 statistics.
[img_assist|nid=5698|title=|desc=|link=popup|align=left|width=100|height=79]
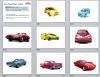
The classic example of a tally is keeping track of how many cars of each colour go past in the street, but that is rather awkward to do in practice.
Use this presentation to save having to leave the comfort of the classroom! It is a PowerPoint slideshow of cars of various colours, to be projected onto the board. Tell learners to keep a tally of how many cars of each colour appear. Where a car has more than one colour, they should put it under the predominant colour.
E1 learners could focus on simply counting (for instance) all the red cars.
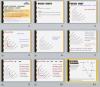
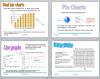
I created this powerpoint to help my students learn the parts and uses of graphs and charts. They can also revisit it on Moodle to remind themselves of labels etc., while revising for the exam.
Editor’s note:
Covers tallies, pictograms, bar charts (vertical, horizontal, single, dual), pie charts, line graphs, conversion graphs and scatter graphs.
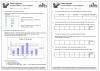
Here is another Level 1-2 variant on the classic ‘Smarties’ investigation which incorporates the use of a PC and Excel. I stopped using Smarties and Skittles because of the health and hygiene issues.
Level
Level 2
Level 1
Maths
Averages and range
Collect organise represent
Functional Maths - handling information and data
ICT
Functional Skills ICT: Developing, presenting and communicating information
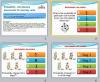
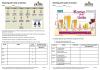
This lesson is designed to embed adding and subtracting, ratio and proportion, etc. whilst looking at the important issue of alcohol consumption and units. Students are able to look at the RDA of alcohol consumption, binge drinking, etc. in the introductory PPT. They can then complete maths worksheet which involves calculating and adding units, converting units and reading data.
It includes a video clips, visual imagery and written notes.
Fully mapped to, and ideal for, L1 Functional Maths.
Level
Level 1
Maths
HD1/L1.1
N1/L1.10
AN N1/L1.7
Functional Maths - numbers and the number system
Functional Maths - handling information and data
General
Generic resources for literacy, numeracy and beyond
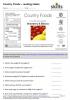
An interesting worksheet that covers both literacy and numeracy. Best used with an interactive food label on the UK Government Eatwell site but the questions can also be answered using the provided printout.
Covers reading comprehension (scanning), extracting information from tables, using decimals and place value.
Level
Entry Level 3
English
Rt/E3.7
Functional English reading
Maths
HD1/E3.1
AN N1/E3.1 place value <1000, odd / even, count in 10s /100s
Car park survey pictogram creator is a clever Excel sheet for recording the different numbers of coloured cars in a car park.
Two versions are available – v1 has 1 picture representing 1 car, version 2 has one picture representing 5 cars.
Skittles pictogram creator is a very clever Excel sheet to accompany our ever popular Smarties data handling resource and it a great way of combining numeracy and IT skills(many tutors are now using Skittles as an alternative to Smarties because there is more variation in the numbers/colours of sweets per packet).