16 piece jigsaw that makes a great ice breaker. First used with older learners who were unused to metric measures, and a younger learner who was unused to imperial. Match metric measure descriptions or quantities with their imperial equivalents to solve the puzzle and complete the triangle. Although converting between systems is only covered at level 2 of the curriculum the creator, Andrea, reports that E3/L1 students cope with this very well, as their life experiences help them.
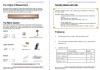
An L1-2 investigation that covers direct proportion (best buy), and rounding / calculating with money /decimals. Two options are included: students can either research Easter egg and chocolate prices on internet shopping sites or use those given. In both cases they must investigate the cost per 100g chocolate and work out the best buy. Final extension work includes consideration of ‘buy one get one free’ and ‘two for £…’ offers.
Editor’s note. New update for 2016 – based on supermarket prices in February 2016
Level
Level 1
Level 2
English
General literacy / English
Maths
AN N2/L1.7
AN N2/L1.6
AN N2/L1.5 Calculate with decimals up to 2dp
AN MSS1/L1.1 Add, subtract, multiply & divide sums of money and record
The New Argos catalogue involves spending a £500 inheritance and comparing the prices in two different Argos catalogues. Covers addition and subtraction (money) and percentage increase/decrease.
Level
Entry Level 3
Level 1
Level 2
Maths
AN MSS1/E3.1 Add & subtract money using decimal notation
AN MSS1/L1.1 Add, subtract, multiply & divide sums of money and record
Pancakes is a series of challenging questions for Shrove Tuesday. The main topic is ratio and proportion but metric measures, money and time are also covered.
Level
Level 1
Level 2
Maths
AN MSS1/L1.3 Calculate with and convert between units of time
A fascinating investigation that shows students how to calculate a body mass index and asks them to investigate the BMI of their choice of celebrities and present the results graphically. Covers formulae, decimals, calculators, converting measures, representing data, averages and range.
An interesting way to improve pie chart skills – whether the chart is calculated and drawn ‘by hand’ or in a spreadsheet. With answer sheet and extension ideas.