This is a practical handling data task at L1 and L2 which uses the Internet to find the necesssary data in order to complete a Expenses claim form.
I work with Landbased students most of whom visit an exhibition at the Bath & West show ground. In this task they have to work out how much it will cost them to travel to the site and how much the entry fee is, then enter this information onto a expenses claim form as if they were submitting it to an employed to reclaim their costs.
For L2 students they need to find the actual cost of the fuel they use for the journey.
Using a video from YouTube (http://www.youtube.com/watch?v=r6eTr4ldDYg) about the miniature earth I have created this PowerPoint on percentages. It will work well with John Thompson’s easy percentage worker-outer and Margaret Adams’ Calculating percentages as quantities (links below under “See also”).
Level
Level 1
Maths
Functional Maths - numbers and the number system
AN N2/L1.9 Find simple percentage parts of quantities and measurements
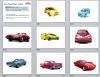
The classic example of a tally is keeping track of how many cars of each colour go past in the street, but that is rather awkward to do in practice.
Use this presentation to save having to leave the comfort of the classroom! It is a PowerPoint slideshow of cars of various colours, to be projected onto the board. Tell learners to keep a tally of how many cars of each colour appear. Where a car has more than one colour, they should put it under the predominant colour.
E1 learners could focus on simply counting (for instance) all the red cars.
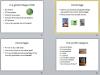
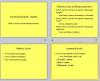
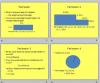
An animated PowerPoint presentation (86 slides) that covers several topics: Fractions & Percentages;Units of Measure; Charts & Graphs; Ratio, Scale & Proportion; Perimeter, Area & Volume; Averages and Range. There are also some links for a planned inclusion of other topics at a later date (Time & Money, Tables and Formulae).
This presentation can be used in class, driven by the teacher, but it is also ideal as a guide for self-study.
Not really suitable for handouts, as there are many animated sequences that would overlap on the printed page.
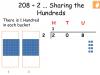
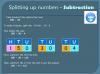
A fully animated Powerpoint presentation that can be used as part of a lesson or for independent study. A series of steps of increasing complexity start by illustrating the basic process of a simple division of whole numbers to end with the interpretation of remainders in everyday situations.
Please note this an animated PPT and is not suitable for delivery as printed handouts.
In the construction trades there is still a need for some students to understand the difference between Imperial and metric units of measure. This is a Powerpoint presentation to help with this. I have used it with E3 and L1 students.
Editor’s note
I have classified this as L1 and L2.
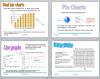
I created this powerpoint to help my students learn the parts and uses of graphs and charts. They can also revisit it on Moodle to remind themselves of labels etc., while revising for the exam.
Editor’s note:
Covers tallies, pictograms, bar charts (vertical, horizontal, single, dual), pie charts, line graphs, conversion graphs and scatter graphs.
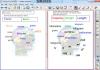
[img_assist|nid=5161|title=|desc=|link=popup|align=left|width=100|height=70]A notebook file to help support learners with different units of metric measurement and to show how length, weight and capacity follow similar paths. The notebook file includes lots of drag and drop sorting activities and finishes by introducing a separate PDF worksheet that focuses on metric units of length.