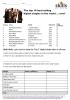
I’ve adapted a resource made by Janet Wilkins on your site in 2008 (see link below under See also), on global best selling singles-making a pie chart. I’ve updated it for the digital age! You’ll see what I mean…..enjoy.
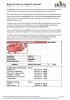
I have created this worksheet to assess learners in reading and extracting data, solving problems on budgeting expenses when standing orders, direct debits and wages are expected on different dates.
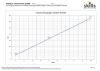
I have created this worksheet to assess learners studying maths at level 2 in solving problems which involve extracting and interpreting continuous data from the conversion line graph metres to feet and calculating, comparing and estimating with units of length in the Imperial and metric system.
I have created this worksheet to assess Entry Level 3 maths learners in their ability to understand time in the 12-hour and 24-hour clock and reading analogue and 12-hour digital clocks to the nearest five minutes.
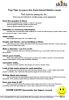
I have created this mini task to assess numeracy/functional skills learners (Entry level 3 to level 1) in
- understanding and using common date formats
- using a calendar
- reading time in the 12-hour and 24-hour formats
- recording time in the 12-hour analogue clock
- knowing that 12:00 or 1200 is midday
Level
Level 1
Entry Level 3
Maths
AN MSS1/L1.3 Calculate with and convert between units of time
AN MSS1/L1.2 Read & measure time and use timetables
20 literacy and numeracy questions to warm up the new term! All based on the words HAPPYNEWYEAR (can easily be adapted for other festivals such a Diwali, New Year’s Eve or Ramadan). Covers vowels, consonants, number, ratios, simple substitution, range, mode and more!
Ideal for mixed ability groups (E1-L2). Also provides very good practice in reading instructions carefully.
For higher level groups it could be completed in teams as a speed test.
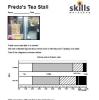
The main resource has four pages. Three of the pages contain a chart and a brief to a group of students to discuss and write some sentences saying what the chart tells them. The twist is that each group of 3 students has a different chart drawn from the same data as the groups next to them. The fourth page has the table from which the charts were drawn.
The charts used are: dual/clustered bar chart comparing types of drink sold on two days. A stacked/composite bar chart and a percentage bar chart of the same data.
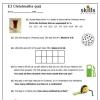
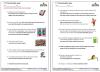
A seasonal themed maths quiz I created for my E3 students using Carrie Bray’s excellent “45 Christmas Questions” resource as a base. It was designed to provide a fun informal assessment on some of the topics covered in the half-term leading to Christmas.
A Level 1 version is also available.
Editor’s note
You can find Carrie’s original resource (which covered E3-L2) under See also below.
A seasonal themed maths quiz I created using Carrie Bray’s excellent “45 Christmas Questions” resource as a base. It was designed to provide a fun informal assessment on some of the topics covered in the half-term leading to Christmas.
An E3 version is also available
Editor’s note
You can find Carrie’s original resource (which covered E3-L2) under See also below.