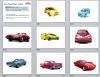
The classic example of a tally is keeping track of how many cars of each colour go past in the street, but that is rather awkward to do in practice.
Use this presentation to save having to leave the comfort of the classroom! It is a PowerPoint slideshow of cars of various colours, to be projected onto the board. Tell learners to keep a tally of how many cars of each colour appear. Where a car has more than one colour, they should put it under the predominant colour.
E1 learners could focus on simply counting (for instance) all the red cars.
Learners round the same number to a several different degrees of precision. This reinforces that the important thing about rounding is what one is rounding to..
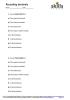
A set of 10 problems. Learners revise choosing the correct operation (addition, subtraction, multiplication or division) and carrying out the calculation correctly.
Ideal for Entry 3 Functional Maths.
Answer sheet provided
Covers geometric drawings, area, perimeter, money, metric measures, tallies, line graphs and much more.
Fully mapped to the Functional Maths criteria and process skills. With answer sheet.
Editor’s note
Wonderful open ended project. Ideal for E3-L2 mixed ability groups.
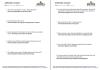
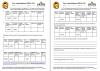
An updated version of Gordon Noblett’s 2011 resource (see below). This version includes the correct tax allowances and information for 2012-13. It also includes an answer sheet. The original description is repeated below.
Challenging and very functional worksheets where learner must complete the missing information and calculate the take-home pay etc. for various UK tax payers. There are also some interesting open questions that are ideal for Functional Maths interpreting skills.
[img_assist|nid=5368|title=|desc=|link=popup|align=left|width=100|height=71]
Level
Level 2
Maths
N2/L2.9
MSS1/L2.1
AN N2/L2.8 Find percentage parts of quantities and measurements
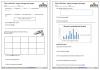
Mean, Mode, Median and Range: Investigation into house prices.
Students use www.rightmove.co.uk to explore house prices in areas of their choice. For example pairs of students could explore house prices in different cities in the UK.
They will need access to computers. You will also need to establish criteria before they start to collect their data so that like for like houses are being compared. For example all of the groups are to compare prices of 2 bedroom flats in the cities of their choice.
Level
Level 2
Level 1
Maths
HD1/L2.4
HD1/L2.3
HD1/L1.4
HD1/L1.3
Functional Maths - handling information and data
ICT
Functional Skills ICT: Finding and selecting information
[img_assist|nid=5329|title=|desc=|link=popup|align=left|width=100|height=70]A set of differentiated tasks for construction students. I used the E3-L1 task with my Entry to L1 group and then the more challenging task with my L1-L2 students.
The use of measure is aways useful for my students as it is something they need to practise constantly given their vocational areas. The lesson was enjoyed by all, especially the hands-on measuring task prompted lots of fun and discussion. Encourage students to get others to check their measurements and validate their results.
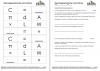
Powerpoint for practising numbers to 20, not necessarily all at once.
Used as a starter with all ESOL maths groups to check the spelling of numbers. I created it for E1 / E2 and it could be used for ESOL, Literacy or Numeracy classes.
A selection of smileys are shown on each slide. Clicking reveals the number (as a digit) and a further click reveals the number spelt out as a word. Good used with small individual whiteboards.
Level
M8
Entry Level 1
English
Ww/E1.1
Maths
AN N1/E1.2 Read & write numbers up to 10 inc. zero
AN N1/E1.1 Count reliably up to 10 items
Pre-entry
pre-Entry N1/M8.1 Join in rote counting to 10
ESOL
ESOL Ww/E1.1a Use and spell correctly some personal key words and familiar words
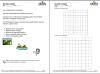
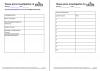
Students fill in how they spend their time. Some may colour code, some may write in the boxes. Then they work out how much time they spend on each activity per week.
It’s up to them (or you!) how they present their answers. For example, as a written report, as bullet points, as a bar chart, pie chart (using a spreadsheet), etc.
A power point and interactive cards to introduce the students to reversing calculations / formulas.
The animated PPT demonstrates the basics of how to rearrange formulae and use reverse calculations to self check answers.
The cards with symbols, can be used to physically rearrange the formula showing the moves of each symbol. These allow the tutor to spend some time talking the less able students through the process. Students can then use the card to complete a short worksheet.