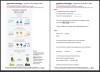
The Office of National Statistics (ONS) is a rich source of data, charts and graphs.In particular, infographics are becoming ever more popular. They can tell complex statistical stories in an easy to grasp manner but also open doors to further mathematical interpretation and investigation.
The Office of National Statistics (ONS) is a rich source of data, charts and graphs.In particular, infographics are becoming ever more popular. They can tell complex statistical stories in an easy to grasp manner but also open doors to further mathematical interpretation and investigation.
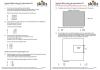
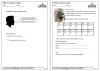
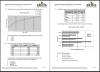
6 very useful, multi-stage topic-based Functional Maths questions. (Each question has 2 or 3 parts)
Covers a wide range of skills including money, distance charts, conversion graphs, and percentages.
Ideal for assessment or revision.
Editor’s note
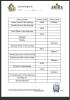
With answer sheet and suggested marks. This is just one of a set of 10 worksheets.
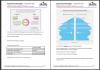
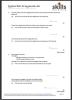
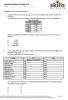
16 very useful multiple choice, topic-based Functional Maths questions.
Covers scale drawings (ruler required), ratios and direct proportion.
Ideal for assessment or revision.
Editor’s note
No answer sheet.
This is just one of a set of 10 worksheets.
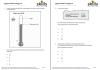
12 very useful multiple choice, topic-based Functional Maths questions.
Covers money, large numbers, money conversions, subtracting decimals, ordering, and rounding.
Ideal for assessment or revision.
Editor’s note
No answer sheet.
This is just one of a set of 10 worksheets.
12 very useful multiple choice, topic-based Functional Maths questions.
Covers estimating proportion / fractions, equivalents, and fractions of amounts.
Ideal for assessment or revision.
Editor’s note
No answer sheet.
This is just one of a set of 10 worksheets.
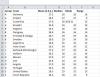
An interesting meld of description, investigation, paired discussion and tasks.
Ideal introduction to L1 averages – also useful at high E3.
Adapted from one page of Nikki Gilbey’sData Collection and Averages – functional tasks (listed below under See also).
24 very useful multiple choice, topic-based Functional Maths questions.
Covers tables, (dual) bar charts, line graphs, pie charts, misleading charts, presenting data, tallies.
Ideal for assessment or revision.
Editor’s note
No answer sheet.
This is just one of a set of 10 worksheets.