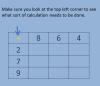
This is a set of part-blanked times tables grids for students to complete and use as a resource. Used with Entry level students. Includes 10×10 and 12×20 grids, with full and gap versions.
Editor’s note
Can be printed and completed on paper, or used on-screen.
Simulations of email and online banking registration forms. Can be used in succession, as for the banking registration form you need an email address. When you press the “create account” button it will open the printing menu. Good luck!
This is a practical handling data task at L1 and L2 which uses the Internet to find the necesssary data in order to complete a Expenses claim form.
I work with Landbased students most of whom visit an exhibition at the Bath & West show ground. In this task they have to work out how much it will cost them to travel to the site and how much the entry fee is, then enter this information onto a expenses claim form as if they were submitting it to an employed to reclaim their costs.
For L2 students they need to find the actual cost of the fuel they use for the journey.
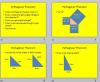
This PowerPoint was used to introduce Pythagoras’ Theorem to Functional Skills college students whose main course work is to do with the Building Trades (Carpenters, Electricians). The last 4 slides therefore deal with using Pythagoras’ theorem to calculate the length of roof rafters.
Editor’s note
I realise that using Pythagoras’ theorem is beyond the scope of L2 Functional Maths Exams but this is a very useful PPT due to the vocational questions. Would also be useful for GCSE Maths.
Using a video from YouTube (http://www.youtube.com/watch?v=r6eTr4ldDYg) about the miniature earth I have created this PowerPoint on percentages. It will work well with John Thompson’s easy percentage worker-outer and Margaret Adams’ Calculating percentages as quantities (links below under “See also”).
Level
Level 1
Maths
Functional Maths - numbers and the number system
AN N2/L1.9 Find simple percentage parts of quantities and measurements
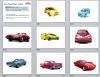
The classic example of a tally is keeping track of how many cars of each colour go past in the street, but that is rather awkward to do in practice.
Use this presentation to save having to leave the comfort of the classroom! It is a PowerPoint slideshow of cars of various colours, to be projected onto the board. Tell learners to keep a tally of how many cars of each colour appear. Where a car has more than one colour, they should put it under the predominant colour.
E1 learners could focus on simply counting (for instance) all the red cars.
An animated PowerPoint presentation (86 slides) that covers several topics: Fractions & Percentages;Units of Measure; Charts & Graphs; Ratio, Scale & Proportion; Perimeter, Area & Volume; Averages and Range. There are also some links for a planned inclusion of other topics at a later date (Time & Money, Tables and Formulae).
This presentation can be used in class, driven by the teacher, but it is also ideal as a guide for self-study.
Not really suitable for handouts, as there are many animated sequences that would overlap on the printed page.
Powerpoint for practising numbers to 20, not necessarily all at once.
Used as a starter with all ESOL maths groups to check the spelling of numbers. I created it for E1 / E2 and it could be used for ESOL, Literacy or Numeracy classes.
A selection of smileys are shown on each slide. Clicking reveals the number (as a digit) and a further click reveals the number spelt out as a word. Good used with small individual whiteboards.
Level
M8
Entry Level 1
English
Ww/E1.1
Maths
AN N1/E1.2 Read & write numbers up to 10 inc. zero
AN N1/E1.1 Count reliably up to 10 items
Pre-entry
pre-Entry N1/M8.1 Join in rote counting to 10
ESOL
ESOL Ww/E1.1a Use and spell correctly some personal key words and familiar words