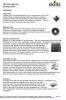
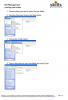
This is a set of worksheets in a MS Excel workbook that deals with fractions.
- Sheet one: a set of pictures (pie charts) that shows fractions from halves to tenths
- Sheet two: equivalent fractions with two pie charts, learners can input fractions and see if they are equivalent by looking at the shape of the pie charts
- Sheet three: starting to look at fractions being equivalent to decimals with two pie charts one for fractions and one for decimals
Level
GCSE L1-5
Level 2
Level 1
Maths
N2/L2.3
N2/L2.1
Adult Numeracy N2/L2.2
Adult Numeracy N2/L1.3
GCSE N10 (Work interchangeably with terminating decimals & their corresponding fractions)
Rugby themed task on reading (use of quotations and dialogue, facts versus opinions), researching and writing a short article. Topic links to ICT, suitable for use during e.g. Rugby World Cup, Six Nations Tournament or with any group keen on sport![img_assist|nid=5708|title=|desc=|link=popup|align=left|width=100|height=71]
Level
Entry Level 3
Level 1
Level 2
English
Functional English - speaking, listening & communicating
Functional English reading
Functional English - writing
General literacy / English
ICT
Functional Skills ICT: Developing, presenting and communicating information
Entry 3 ICT
Functional Skills ICT: Finding and selecting information
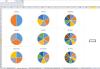
I’ve adapted a resource made by Janet Wilkins on your site in 2008 (see link below under See also), on global best selling singles-making a pie chart. I’ve updated it for the digital age! You’ll see what I mean…..enjoy.
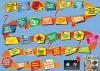
This is a fabulous board game created as a fun and gentle introduction to L1-2 Functional ICT (or other ICT type classes). It also makes a good ice breaker at the beginning of term. Best printed onto A3 and laminated.
There is also an extra bonus ‘Quiz makers’ game available online (link available on the answer sheet).
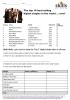
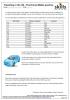
I created this resource as practice in data handling for a Level 1 Functional Maths group and it covers skills from Entry 3 to Level 2. It includes creating tallies and charts, using a distance chart, calculating average and range, and working with money. It is fully mapped to the Functional Maths criteria and includes an answer sheet.
My students are 16-18, and have a limited knowledge of geography, so I included an outline map of the UK (not included in the resource) and got them to use a road map to find and mark the cities and towns that are on the distance chart.
An interesting way to improve pie chart skills – whether the chart is calculated and drawn ‘by hand’ or in a spreadsheet. With answer sheet and extension ideas.