Free Functional Skills and Skills for Life resources
Site Search
HD1/E2.5
Represent information so that it makes sense to others.
(a) Understand that information can be represented in different ways, e.g. a list, a table, a diagram
(b) Understand the importance of labelling information in tables and diagrams
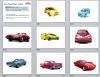
The classic example of a tally is keeping track of how many cars of each colour go past in the street, but that is rather awkward to do in practice.
Use this presentation to save having to leave the comfort of the classroom! It is a PowerPoint slideshow of cars of various colours, to be projected onto the board. Tell learners to keep a tally of how many cars of each colour appear. Where a car has more than one colour, they should put it under the predominant colour.
E1 learners could focus on simply counting (for instance) all the red cars.
A fabulous 19 page booklet providing comprehensive coverage of measuring length at Entry 2 (and above). Cleverly links in with all the Entry 2 data handling elements by asking learners to record data in tables and bar charts. Includes using non-standard units, estimating and measuring height, using bar charts and tables and interpreting the results, measuring lines, investigations, frog jumping and paper aeroplane races; plus student progress tracker.
Entry 2 handling data practice test in Edexcel-style. Great for extra practice and revision. 6 pages plus answer sheet. Covers many E2 HD1 (data and statistical measures) elements.
Grids for Smartie bar charts and pictograms – to accompany Smartie investigation (below). Ideal for Entry 2-3 students that are not confident with a blank sheet of graph paper.