A useful introductory PPT and accompanying team data sheets for covering L1-2 statistics.
[img_assist|nid=5698|title=|desc=|link=popup|align=left|width=100|height=79]
A power point and interactive cards to introduce the students to reversing calculations / formulas.
The animated PPT demonstrates the basics of how to rearrange formulae and use reverse calculations to self check answers.
The cards with symbols, can be used to physically rearrange the formula showing the moves of each symbol. These allow the tutor to spend some time talking the less able students through the process. Students can then use the card to complete a short worksheet.
In the construction trades there is still a need for some students to understand the difference between Imperial and metric units of measure. This is a Powerpoint presentation to help with this. I have used it with E3 and L1 students.
Editor’s note
I have classified this as L1 and L2.
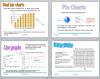
I created this powerpoint to help my students learn the parts and uses of graphs and charts. They can also revisit it on Moodle to remind themselves of labels etc., while revising for the exam.
Editor’s note:
Covers tallies, pictograms, bar charts (vertical, horizontal, single, dual), pie charts, line graphs, conversion graphs and scatter graphs.
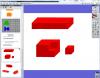
Lovely introduction to perimeter, area and volume. The learner can move squares and 3D blocks around to see how area and volume relate to physical squares / cubes.
Please note you must have the ActivInspire interactive whiteboard software installed on your computer in order to open, view and use the flipchart resource.
A free personal edition is available for download at http://support.prometheanplanet.com/
[img_assist|nid=4809|title=|desc=|link=popup|align=left|width=100|height=76]Useful set of two resources.
1) A Smart notebook file that introduces the topic, provides practice questions and finishes with a room decorating project and a self-assessment check.
Please note you must have the Smart notebook software installed on your computer in order to open, view and use this resource http://smarttech.com/
2) PowerPoint scale diagram multiple choice quiz (5 questions) makes a good final activity or use later for revision.
Great for Functional Maths and/or employability classes, this set of resources explore the different levels of the minimum wage. A PPT introduces the topic and demonstrates how to solve some sample problems about the wages bill of a sandwich shop with 4 employees aged between 16 and 35. (Adding up and multiplying money).
The accompanying worksheet provides further practice and consolidation and includes extension questions.
Level
Level 2
Level 1
Maths
AN MSS1/L1.1 Add, subtract, multiply & divide sums of money and record
Lovely wall to help students get to grips with equivalents. Covers 1/2, /1/3, 1/4, 1/5, 1/6, 1/8, 1/9, 1/10 and 1/12ths. Great for display on an interactive whiteboard and for laminating and using with dry wipe pens, etc.
Forms part of a set of 5 resources linked to an excellent L1-2 lesson plan (that focuses on expressing one number as a fraction of another).
Step by step method for working out any percentage using easy mental maths methods such as dividing by 10 or 100; doubling and adding up. An example is included and a blank “bubble template “ to users to use with their own percentage problems. A smart notebook version of the template is also included.
Please note you must have the Smart Notebook software installed on your computer in order to open, view and use the Notebook resource http://smarttech.com/
Level
Level 2
Level 1
Maths
AN N2/L2.8 Find percentage parts of quantities and measurements
Functional Maths - numbers and the number system
AN N2/L1.9 Find simple percentage parts of quantities and measurements