In this activity, learners have to calculate how much paint is required for a specified job, find prices from different sources and work out total prices. This can then be compared. The resource is in two versions – one with formulae for the required calculations and one without – different pages from each version can be mixed and match to meet different learners’ needs.
The activity requires internet access – however price lists could be substituted for this if this is not available in your context.
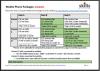
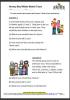
A worksheet giving details of 4 different whale watching tours (times, cost, accessibility, activities, etc.).
This is followed by 4 different scenarios, each describing a family or group. Students must choose the best tour for each group and work out the costs. As this holiday activity is in Australia, the price are in $AUD. An extra exercise could be to use the current exchange rate to work out the cost in your own currency.Includes answers.
An introductory PPT based task to find the value of the three words in ‘Happy New Year’, given certain values for each letter. This is followed up by a set of question cards on calculations with the letters of Happy New Year and an algebra worksheet with the same given values, using BODMAS.
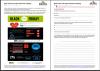
Based on two recent articles / surveys on Black Friday shopping, the main focus of this resource is Functional Mathematics but there is also an introductory page of English questions that check vocabulary, purpose of text and the ability to extract meaning from graphical material and captions.
This is followed by three pages of challenging differentiated questions for E3-L2 Functional Maths – all are based on the infographics within the text. Topics include large numbers, percentages, fractions and the four operations.
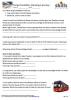
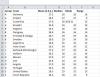
Students regularly tell me they cannot read bus timetables and just wait for the next one to come along! This activity asks learners to find the most appropriate bus for my journey.
I print the timetables (pages 2-8) out enlarged to A3 and stick them to walls of my classroom.
Update (June 2016)
Answer sheet (and error report for one question) kindly provided by Ray Sheerin and Jay Hall, Aylesbury, Bucks, Adult Learning.
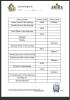
Level
Entry Level 3
Level 1
Maths
AN MSS1/L1.3 Calculate with and convert between units of time
AN MSS1/L1.2 Read & measure time and use timetables
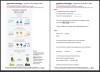
The Office of National Statistics (ONS) is a rich source of data, charts and graphs.In particular, infographics are becoming ever more popular. They can tell complex statistical stories in an easy to grasp manner but also open doors to further mathematical interpretation and investigation.
A Functional Skills based project aimed at my Public Service students who are going to be on a Stewarding course. I linked some questions about rotas and timetables with a question about steward to crowd ratios to tie in with their short course.