Functional skills maths.
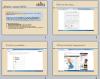
Extract information from mileage and distance (network) diagrams. Complete a mileage chart. Editor’s note
With worked solutions, pop up help and a final challenge question.
Ideal as an introduction or for revision.
PPT with title slide and 3 slides and a set of suggested questions to go with it.
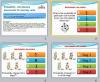
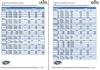
A further worksheet showing the number of seats for the parties for the last and new parliament with tasks for E3 to L2 learners.
Editor’s note
A great resource for prompting general discussion about elections, statistics, etc.
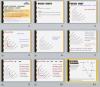
This is a PowerPoint slide show on ratios (with answers) to use with Army soldiers. The subject matter is Adventurous Training and Mountain Leader Trainers (MLTs). Most of the presentation deals with the instructor/novice ratio. The final slide is about ammunition.
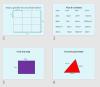
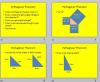
This PowerPoint was used to introduce Pythagoras’ Theorem to Functional Skills college students whose main course work is to do with the Building Trades (Carpenters, Electricians). The last 4 slides therefore deal with using Pythagoras’ theorem to calculate the length of roof rafters.
Editor’s note
I realise that using Pythagoras’ theorem is beyond the scope of L2 Functional Maths Exams but this is a very useful PPT due to the vocational questions. Would also be useful for GCSE Maths.
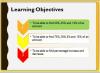
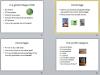
Using a video from YouTube (http://www.youtube.com/watch?v=r6eTr4ldDYg) about the miniature earth I have created this PowerPoint on percentages. It will work well with John Thompson’s easy percentage worker-outer and Margaret Adams’ Calculating percentages as quantities (links below under “See also”).
Level
Level 1
Maths
Functional Maths - numbers and the number system
AN N2/L1.9 Find simple percentage parts of quantities and measurements
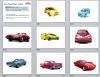
The classic example of a tally is keeping track of how many cars of each colour go past in the street, but that is rather awkward to do in practice.
Use this presentation to save having to leave the comfort of the classroom! It is a PowerPoint slideshow of cars of various colours, to be projected onto the board. Tell learners to keep a tally of how many cars of each colour appear. Where a car has more than one colour, they should put it under the predominant colour.
E1 learners could focus on simply counting (for instance) all the red cars.