I’ve adapted a resource made by Janet Wilkins on your site in 2008 (see link below under See also), on global best selling singles-making a pie chart. I’ve updated it for the digital age! You’ll see what I mean…..enjoy.
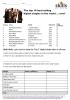
I created this resource as practice in data handling for a Level 1 Functional Maths group and it covers skills from Entry 3 to Level 2. It includes creating tallies and charts, using a distance chart, calculating average and range, and working with money. It is fully mapped to the Functional Maths criteria and includes an answer sheet.
My students are 16-18, and have a limited knowledge of geography, so I included an outline map of the UK (not included in the resource) and got them to use a road map to find and mark the cities and towns that are on the distance chart.
Investigate the possibility of a college stocking fairly traded products in its canteen. Covers many reading, writing, ICT, numeracy, speaking and listening skills inc. data handling, report writing, creating charts and questionnaires, giving a presentation, etc. Ideal for embedding all three functional skills (or literacy, numeracy and ICT) especially for business students.
Level
Level 1
Level 2
English
Functional Skills English
General literacy / English
Maths
Data Handling
Functional Maths
ICT
Functional ICT
Level 1 and 2 CLAIT / ECDL
General
Generic resources for literacy, numeracy and beyond
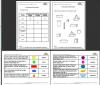
A great set of resources for all levels from E1-L2. Includes information and worksheets, card / matching games and an IT drawing exercise.
Functional skills mapping and minor corrections made – August 2011.
An interesting way to improve pie chart skills – whether the chart is calculated and drawn ‘by hand’ or in a spreadsheet. With answer sheet and extension ideas.
What’s the weather like? and Party Time! are two ‘real-life’ task sheets that involve budgeting, Excel charts and tables, rounding and checking, and finding mean and range.
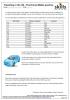
Two task sheets – one for beauty therapists, one for motor vehicle students, etc. Find information, work out total cost, mean and range, display your results in a chart. (Originally used for Level 1 Key Skills Application of Number portfolio work).