Graphs & Charts
Submitted by Chris Farrell on 25 April 2012.
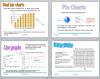
I created this powerpoint to help my students learn the parts and uses of graphs and charts. They can also revisit it on Moodle to remind themselves of labels etc., while revising for the exam.
Editor’s note:
Covers tallies, pictograms, bar charts (vertical, horizontal, single, dual), pie charts, line graphs, conversion graphs and scatter graphs.
Resource File(s)
Resource type
Physical format
16 slides
- Log in to post comments
See also
More like this