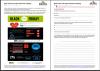
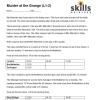
Based on two recent articles / surveys on Black Friday shopping, the main focus of this resource is Functional Mathematics but there is also an introductory page of English questions that check vocabulary, purpose of text and the ability to extract meaning from graphical material and captions.
This is followed by three pages of challenging differentiated questions for E3-L2 Functional Maths – all are based on the infographics within the text. Topics include large numbers, percentages, fractions and the four operations.
A useful introductory PPT and accompanying team data sheets for covering L1-2 statistics.
[img_assist|nid=5698|title=|desc=|link=popup|align=left|width=100|height=79]
This is an adaptation of Murder at the Grange, which my students have always enjoyed.
I wanted to extend the work on calculating with time, so learners have to use and extend timetables and calculate multi-stage journey times. I also thought it would be good to have some female characters!
Level
Level 2
Level 1
Entry Level 3
Entry Level 2
Maths
AN MSS1/L2.2 Calculate, measure and record time
AN MSS1/L1.3 Calculate with and convert between units of time
AN MSS1/L1.2 Read & measure time and use timetables
I have created this to enable learners to estimate and calculate and to emphasis the (financial) costs of smoking. Editor’s note
With Functional maths mapping.
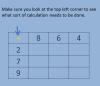
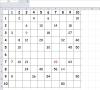
This is a set of part-blanked times tables grids for students to complete and use as a resource. Used with Entry level students. Includes 10×10 and 12×20 grids, with full and gap versions.
Editor’s note
Can be printed and completed on paper, or used on-screen.
A power point and interactive cards to introduce the students to reversing calculations / formulas.
The animated PPT demonstrates the basics of how to rearrange formulae and use reverse calculations to self check answers.
The cards with symbols, can be used to physically rearrange the formula showing the moves of each symbol. These allow the tutor to spend some time talking the less able students through the process. Students can then use the card to complete a short worksheet.
In the construction trades there is still a need for some students to understand the difference between Imperial and metric units of measure. This is a Powerpoint presentation to help with this. I have used it with E3 and L1 students.
Editor’s note
I have classified this as L1 and L2.
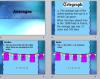
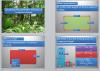
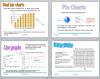
I created this powerpoint to help my students learn the parts and uses of graphs and charts. They can also revisit it on Moodle to remind themselves of labels etc., while revising for the exam.
Editor’s note:
Covers tallies, pictograms, bar charts (vertical, horizontal, single, dual), pie charts, line graphs, conversion graphs and scatter graphs.