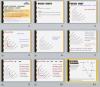
Functional skills maths.
Extract information from mileage and distance (network) diagrams. Complete a mileage chart. Editor’s note
With worked solutions, pop up help and a final challenge question.
Ideal as an introduction or for revision.
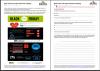
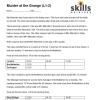
Based on two recent articles / surveys on Black Friday shopping, the main focus of this resource is Functional Mathematics but there is also an introductory page of English questions that check vocabulary, purpose of text and the ability to extract meaning from graphical material and captions.
This is followed by three pages of challenging differentiated questions for E3-L2 Functional Maths – all are based on the infographics within the text. Topics include large numbers, percentages, fractions and the four operations.
An interesting meld of description, investigation, paired discussion and tasks.
Ideal introduction to L1 averages – also useful at high E3.
Adapted from one page of Nikki Gilbey’sData Collection and Averages – functional tasks (listed below under See also).
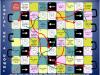
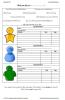
A counting game along similar lines to Snakes and Ladders. Learners will learn turn-taking, following instruction & basic counting skills. In addition, they will pick up social and communication skills along the way.
(Print onto A3 – a dice and counters needed)
Editor’s note
A PPT version is also included to enable the game to be played on a smartboard.
Level
M8
Entry Level 1
English
SLlr/E1.3
Maths
AN N1/E1.1 Count reliably up to 10 items
Functional Maths - numbers and the number system
Pre-entry
pre-Entry SLlr/M8.3 Listen to and answer simple single step instructions / requests
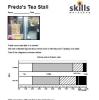
The main resource has four pages. Three of the pages contain a chart and a brief to a group of students to discuss and write some sentences saying what the chart tells them. The twist is that each group of 3 students has a different chart drawn from the same data as the groups next to them. The fourth page has the table from which the charts were drawn.
The charts used are: dual/clustered bar chart comparing types of drink sold on two days. A stacked/composite bar chart and a percentage bar chart of the same data.
This is an adaptation of Murder at the Grange, which my students have always enjoyed.
I wanted to extend the work on calculating with time, so learners have to use and extend timetables and calculate multi-stage journey times. I also thought it would be good to have some female characters!
Level
Level 2
Level 1
Entry Level 3
Entry Level 2
Maths
AN MSS1/L2.2 Calculate, measure and record time
AN MSS1/L1.3 Calculate with and convert between units of time
AN MSS1/L1.2 Read & measure time and use timetables
I have created this to enable learners to estimate and calculate and to emphasis the (financial) costs of smoking. Editor’s note
With Functional maths mapping.
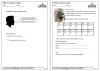
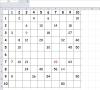
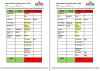
This is a set of part-blanked times tables grids for students to complete and use as a resource. Used with Entry level students. Includes 10×10 and 12×20 grids, with full and gap versions.
Editor’s note
Can be printed and completed on paper, or used on-screen.
This activity encourages ESOL students:
- To communicate with each other while moving around the classroom,
- To revise Past Simple (questions and answers),
- To practise basic numeracy (subtraction).
With extensive teachers’ notes
Level
Entry Level 2
Entry Level 1
Maths
AN N1/E3.2
ESOL
ESOL Sc/E2.2a make requests: ask for things or action
ESOL Sc/E1.1a Use stress & intonation to make speech comprehensible
ESOL Lr/E1.4a Listen and respond to requests for personal information