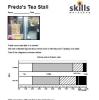
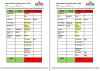
The main resource has four pages. Three of the pages contain a chart and a brief to a group of students to discuss and write some sentences saying what the chart tells them. The twist is that each group of 3 students has a different chart drawn from the same data as the groups next to them. The fourth page has the table from which the charts were drawn.
The charts used are: dual/clustered bar chart comparing types of drink sold on two days. A stacked/composite bar chart and a percentage bar chart of the same data.
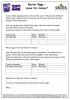
Two task sheets. The first, ‘My Budget’, encourages learners to compare their current budget with what it could be if they were in employment.
The second was used on an ASDAN Unit 3 business planning course and encourages discussion about the costs of self-employment.
Suitable for underpinning Functional Maths (E3 upwards).
Level
Entry Level 3
Level 1
Level 2
English
Functional English - speaking, listening & communicating
Maths
Functional Maths - measures, shape & space
AN MSS1/E3.1 Add & subtract money using decimal notation
MSS1/E3.2
AN MSS1/L1.1 Add, subtract, multiply & divide sums of money and record
An L1-2 investigation that covers direct proportion (best buy), and rounding / calculating with money /decimals. Two options are included: students can either research Easter egg and chocolate prices on internet shopping sites or use those given. In both cases they must investigate the cost per 100g chocolate and work out the best buy. Final extension work includes consideration of ‘buy one get one free’ and ‘two for £…’ offers.
Editor’s note. New update for 2016 – based on supermarket prices in February 2016
Level
Level 1
Level 2
English
General literacy / English
Maths
AN N2/L1.7
AN N2/L1.6
AN N2/L1.5 Calculate with decimals up to 2dp
AN MSS1/L1.1 Add, subtract, multiply & divide sums of money and record
Florence was not just a famous nurse, she was also a very good mathematician. Use this resource to introduce pie charts, promote class discussion and learn some history!