I’ve adapted a resource made by Janet Wilkins on your site in 2008 (see link below under See also), on global best selling singles-making a pie chart. I’ve updated it for the digital age! You’ll see what I mean…..enjoy.
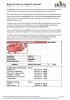
I have created this worksheet to assess learners in reading and extracting data, solving problems on budgeting expenses when standing orders, direct debits and wages are expected on different dates.
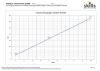
I have created this worksheet to assess learners studying maths at level 2 in solving problems which involve extracting and interpreting continuous data from the conversion line graph metres to feet and calculating, comparing and estimating with units of length in the Imperial and metric system.
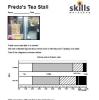
The main resource has four pages. Three of the pages contain a chart and a brief to a group of students to discuss and write some sentences saying what the chart tells them. The twist is that each group of 3 students has a different chart drawn from the same data as the groups next to them. The fourth page has the table from which the charts were drawn.
The charts used are: dual/clustered bar chart comparing types of drink sold on two days. A stacked/composite bar chart and a percentage bar chart of the same data.
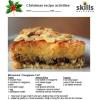
Eight different tasks based on three delightful Christmas mincemeat recipes – accompanied by very enticing photographs!. Suitable for E3-L2. Tasks cover metric measures, a web investigation, converting between metric and Imperial units, and ratio and proportion. Fully mapped to the Functional Maths criteria.
This is an adaptation of Murder at the Grange, which my students have always enjoyed.
I wanted to extend the work on calculating with time, so learners have to use and extend timetables and calculate multi-stage journey times. I also thought it would be good to have some female characters!
Level
Level 2
Level 1
Entry Level 3
Entry Level 2
Maths
AN MSS1/L2.2 Calculate, measure and record time
AN MSS1/L1.3 Calculate with and convert between units of time
AN MSS1/L1.2 Read & measure time and use timetables
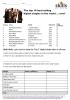
I have created this worksheet to assess learners studying maths at level 2 in solving practical problems which involve extracting and interpreting discrete data from a table and also calculating a percentage increase.
Editor’s note
With Functional Maths and Adult Numeracy curriculum mapping
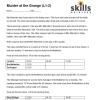
I have created this to enable learners to estimate and calculate and to emphasis the (financial) costs of smoking. Editor’s note
With Functional maths mapping.
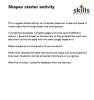
This is a good starter activity to introduce measures, shape and space. It is also useful in dividing classes into small groups.
Using the templates I created I printed them on to card of different colours. I gave the shapes to the learners as they entered the room and told them to find the table with the same shape on it. When they reached the table they found the shape and some questions to answer.
After five minutes I asked for feedback from the learners.