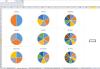
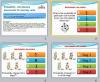
This is a set of worksheets in a MS Excel workbook that deals with fractions.
- Sheet one: a set of pictures (pie charts) that shows fractions from halves to tenths
- Sheet two: equivalent fractions with two pie charts, learners can input fractions and see if they are equivalent by looking at the shape of the pie charts
- Sheet three: starting to look at fractions being equivalent to decimals with two pie charts one for fractions and one for decimals
Level
GCSE L1-5
Level 2
Level 1
Maths
N2/L2.3
N2/L2.1
Adult Numeracy N2/L2.2
Adult Numeracy N2/L1.3
GCSE N10 (Work interchangeably with terminating decimals & their corresponding fractions)
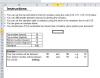
This is a MS Excel resource that is designed to be a useful resource for producing sheets for starter activities or homework. This also provides a tutor marking sheet. The sheet can be used to differentiate by choosing larger or smaller numbers, and can be addition or subtraction.
Editor’s note
Creates printable sheets of 20 problems (plus answer sheets). Clever and useful!
Level
Entry Level 1
Entry Level 2
Entry Level 3
Level 1
Maths
FM Context free underpinning
FM E1.3 Add numbers which total up to 20, & subtract numbers from numbers up to 20
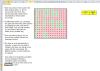
This is an Excel file with a basic odd/even activity. I took inspiration from Jean Thomas’ “Reveal the hidden shapes!” activity from 2005.
With this activity, the tutor can design a picture (or one learner can design a picture for another learner) and it produces a printable sheet. The learner then shades all the odd numbers on the sheet in one colour, and all the even numbers in a different colour – revealing a picture or a message.
There are no macros, so cross-compatibility with Excel shouldn’t be a problem.
Level
Entry Level 2
Entry Level 3
Maths
FM Context free underpinning
FM E2.3 Recognise & sequence odd & even numbers up to 100
AN N1/E3.1 place value <1000, odd / even, count in 10s /100s
AN N1/E2.2 Read, write, order & compare numbers to 100; odd even nos.
AN N1/E2.1 Count reliably to 100, count on in 2s and 10s
Functional skills maths.
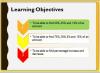
Extract information from mileage and distance (network) diagrams. Complete a mileage chart. Editor’s note
With worked solutions, pop up help and a final challenge question.
Ideal as an introduction or for revision.
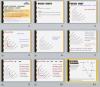
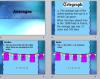
A useful introductory PPT and accompanying team data sheets for covering L1-2 statistics.
[img_assist|nid=5698|title=|desc=|link=popup|align=left|width=100|height=79]
PPT with title slide and 3 slides and a set of suggested questions to go with it.
A further worksheet showing the number of seats for the parties for the last and new parliament with tasks for E3 to L2 learners.
Editor’s note
A great resource for prompting general discussion about elections, statistics, etc.
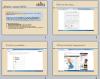
This is a PowerPoint slide show on ratios (with answers) to use with Army soldiers. The subject matter is Adventurous Training and Mountain Leader Trainers (MLTs). Most of the presentation deals with the instructor/novice ratio. The final slide is about ammunition.