I’ve adapted a resource made by Janet Wilkins on your site in 2008 (see link below under See also), on global best selling singles-making a pie chart. I’ve updated it for the digital age! You’ll see what I mean…..enjoy.
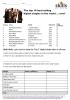
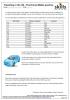
I created this resource as practice in data handling for a Level 1 Functional Maths group and it covers skills from Entry 3 to Level 2. It includes creating tallies and charts, using a distance chart, calculating average and range, and working with money. It is fully mapped to the Functional Maths criteria and includes an answer sheet.
My students are 16-18, and have a limited knowledge of geography, so I included an outline map of the UK (not included in the resource) and got them to use a road map to find and mark the cities and towns that are on the distance chart.
Set of two resources PowerPoint Straightforward but very useful introduction to computers for preEntry and Entry 1 students. Ideal to use before playing the accompanying bingo game. Bingo Eight different boards. Call out the name of the part (or write on the class whiteboard for a literacy group). First to complete a line wins (use counters to cover, or laminate and cross off with a dry wipe pen).
An interesting way to improve pie chart skills – whether the chart is calculated and drawn ‘by hand’ or in a spreadsheet. With answer sheet and extension ideas.
What’s the weather like? and Party Time! are two ‘real-life’ task sheets that involve budgeting, Excel charts and tables, rounding and checking, and finding mean and range.
Two task sheets – one for beauty therapists, one for motor vehicle students, etc. Find information, work out total cost, mean and range, display your results in a chart. (Originally used for Level 1 Key Skills Application of Number portfolio work).