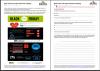
Based on two recent articles / surveys on Black Friday shopping, the main focus of this resource is Functional Mathematics but there is also an introductory page of English questions that check vocabulary, purpose of text and the ability to extract meaning from graphical material and captions.
This is followed by three pages of challenging differentiated questions for E3-L2 Functional Maths – all are based on the infographics within the text. Topics include large numbers, percentages, fractions and the four operations.
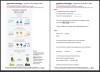
The Office of National Statistics (ONS) is a rich source of data, charts and graphs.In particular, infographics are becoming ever more popular. They can tell complex statistical stories in an easy to grasp manner but also open doors to further mathematical interpretation and investigation.
The Office of National Statistics (ONS) is a rich source of data, charts and graphs.In particular, infographics are becoming ever more popular. They can tell complex statistical stories in an easy to grasp manner but also open doors to further mathematical interpretation and investigation.
A series of topical questions based on recent (Jan 2010) temperatures recorded in Newcastle. Covers mean, mode, median, range, extracting information, fractions, percentages, negative numbers and more. Also suitable for underpinning L1 and L2 Functional Maths.
One of our most endearing and popular resources. This excellent investigation for mixed ability groups has inspired many other Skillsworkshop contributors to create related Smartie resources (see below for just a small selection). Covers almost all data handling curriculum elements from Entry 1 to Level 1 along with other elements from N1 (whole numbers) and Measure. Topics covered include counting, estimating, addition, sorting, tallies, bar charts, mean, range and more.