A quick interactive add-on exercise, created in Wordwall, for the popular New Year 2022 (Warmest New Year's Day) reading resource. Match the organisational and textual features to the correct places on the text.
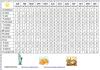
A data chart of average monthly high and low temperatures for a selection of world cities is used to answer functional maths questions.
Skills tested include accuracy of reading data, ordering positive and negative numbers, calculating the mean and range of data including negative numbers.
There is a tricky anagram to finish off the worksheet, which will appeal to some leaners who like puzzles and wordskills.
The chart could be used separately and many other questions devised from the information it contains.